The good Mayor of the city of Eindhoven in The Netherlands is very proud. Compared to other cities in our and other countries the economy in his city is doing extremely well. Innovation, job growth, education, industry, R&D and commerce is booming, so he declared Eindhoven and the surrounding villages to be ‘the Smartest Region in the World’. (for recent figures, see http://fb.me/2f4BXYEAE , in Dutch, hat tip to @pgKroeger)
Sure, every city has a folder with on the back a map with concentric circles showing the driving distances to a number of big European cities. Invariably showing that City X is smack in the centre so if you think of a location for your new office, City X is the best, right?
1. Question: How can other cities in the world be made to boom, prosper and create jobs and wealth, be as successful as Eindhoven? Answers to this question are very urgent since we in a so called “triple dip” crisis since about the year 2008 or maybe even since 2000. Our government has admitted that our economy has scrunk with 1.1% last quarter and since it did not grow in the quarter before that we are now in an official ‘Recession’. In both Spain and Greece the economies are so depressed that unemployment is going up very badly especially for the young even for those that are well educated and recently graduated middle class youth, having to stay home with their probaly unemployed parents.
This is a terrible brew, reminiscent of pre-WWII years. And much more important than to solve bank-supervision or the EU/ Euro. There is uncertainty if this situation will appear soon in France and Italy too and and if it will then move northward. Something has to be done urgently about the economies of the EU as well as jobs in the USA and China, to get us all out of the stagnation, crises and decline.
2. Some answers
Richard Florida has given his recipe years ago to city councils, in his famous book about the Creative Class. Based on observed ans measured statistics in American cities he did see remarkable differences in growth vs. spiraling downwards sliding in cities that boosted the three T’s or not. The Talentful young, Technology in the sense of broadband ICT infrastructure and …..Tolerance for diversity. This last ingredient in the mix met with resistance from various denominations of fundamentalists and from those who have chosen to remain living in closed and inward looking “Oldwhitemanistan”.
And surely making creative new and unexpected mixtures and combinations of components and contributions of these 3 T’s. I have the pleasure to introduce in this paper a fourth T: Transit = p2p transnode connectivity in corridors.
3. What is Transit Connectivity
Whenever we see present spectacular growth there are channels of activity or multi-node corridors at work. For instance the fast growing worldwide optic fibre cable network backbone connecting the huge datacentres of Google looks like this:
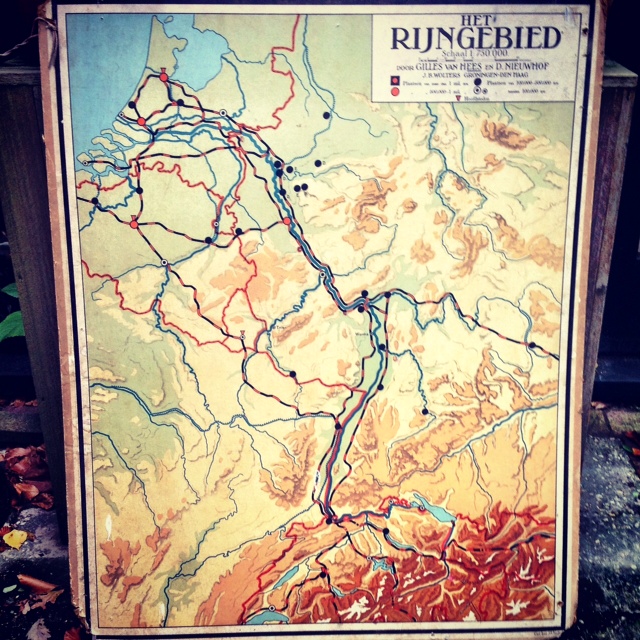
In history very flourishing wealthy cultures sprang up alongsides shipping routes and transport enabling rivers like the Ganges, Indus and Nile, consisting of strings of cities, instead of one central city, like the Eindhoven mayor presents. An example is the River Rhine, which was core to the post WWII growth of the Coal & Steel Treaty that later evolved into the EU:
Its motor was physical transport of passengers and freight on trains and coax and steel products on barges on the river Rhine and its inflowing smaller rivers. The Swiss, French, Germans, Belgians and Dutch benefitted very much from this flowing lifeline.
A more modern and non physical example of ransit connectivity is the huge and fast growing computer network of connected datacenters of Google. Here experiments with Open Flow and Multi Path TCP are done to be able to handle the huge data flow.
4. Recent (physical and non-physical) examples of the success of Transit Structures.
Transnode connectivity can be seen successfully at work in the following two examples.
A. The following trans-European corridor has been described (in part) to me by prof. Jan Smits: — From the middle of England [ Birmingham; north of London; Harwich and Dover; Rotterdam harbor area and Antwerp harbor area; Eindhoven; Venlo; the Ruhr area; Frankfort; downwards along the Rhine, then bending eastwards through Middle Germany (car and chemical industry); Stuttgart; Munchen area, Linz area; Vienna; Budapest Belgrade; Sophia; to and including Istanbul]—
Jan has written me that this corridor is noticeable in some aspects when looking at Europe with Google Earth.
I name this corridor which is trans-nationstate of at least nine countries: ” CORRIDORIA “. May it have a happy and prosperous life! We can start the many millions of people who live and work along these value chains The Corridorians of Europe. New version of this linked city map will appear in my next blog.
It is important to notice that physical AND non-physical flows and transaction streams have started to play a big role. Also non-river transport for passengers and freight have changed the trajectory: by trucks, airplanes, fast trains and their respective logistic systems. The investments in road & train infrastructures, telecommunication & datacenter & internet backbones, FttH and FttB access networks, financial services, energy provision and -transportation and food will no doubt be woven into this corridor first to cope with further growth. So the boasts of mayor of Eindhoven are only partly true. Eindhoven booms but so does he whole chain of cities and areas. Maybe the Mexico based telecom company American Movil, who took a big interest in the NL incumbent KPN as well as in its sister company Telekom Austria has seen the same investment opportunity as I show here? Should we start an investment fund for this whole chain of metro-areas which can act as a motor for the rest of Europe ?
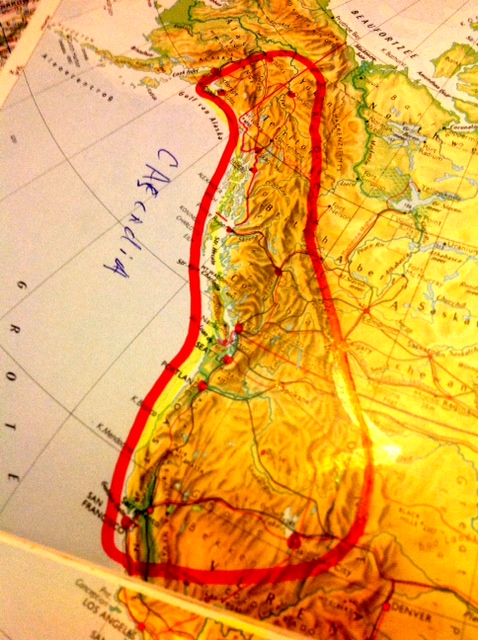
B. A second example of a self sustainable booming bioregional area is a ring formed corridor along the West coast of the USA, Canada and Alaska, called ” CASCADIA “. For a better picture of Cascadia, at least part of it in the USA, see PS 3 below.
Jeff Sterling, who lives there, wrote me about it: “It covers the area from the Northern California coast; all the way up to Prince William Sound in Alaska; down the Continental Divide (geo crust break) to Yellowstone; then across the Great Basin to Northern California again. We are a multi-country economy that is the 8th largest economy in the world, with a population of 20 million and a GDP of $848 billion”. Should we call them the Cascadians?
5. Some background from “network dynamics” theory
Why and how do these network architectural structures create value and prosperity? First of all, the perspective of looking at these (ring) corridors present a clear break from the classical view of sovereign countries like the UK and France.
On one side, we had : Nation State with Central authorities, command and control all centered in the capital; content; area/ territory size (arrable land) and cities as NODES; border controlled.
And on the other side of the transition we will have: Flow, Transport, Transit, diversity, specialisation of knowledge and crafts; Making and creating using translocal Connectivity LINKS that combine and mix between smart nodes.
I must stress that the old and the new are Dual, meaning that Nodes and Links are two sides of the same coin, and are not going to replace each other but are complementary. Seeing the “links side” is however rather new for most politicians, mayors and investors. The exclusive “area & centre view” has been a bit outdated since the times of Napoleon. Since then communications, raw materials, factories, coal mines and oilfields have taken over from crop areas and -yield.
Why do these corridors work? We see ‘hubs and spokes’ appear in most larger dynamic network structures. These ‘hubs’ can be imagined as traffic roundabouts, hub airports, internet exchange (IX) infrastructures or large modern cities. In these modern knowledge infrastructure HUBS, three aspects play vital roles:
I. Access to a destination for visitors; for example communters going in and out of Paris to work there each day.
II. Peering = interconnection of traffic between networks external to the hub. People coming from airplanes that have landed entering other airplanes taking off to continue their journey elsewhere.
III. Transit traffic. For instance passengers staying on a plane after landing at a stopover airport and waiting their for takeoff towards their destination elsewhere.
The key thing for peering and transit to be understood as important is that these three aspects re-enforce each other !! An open hub has the “best connections” too, so it attracts companies to locate offices and factories there. It seems paradoxical at first: For improved Access (I), good Transit (II) and Peering (III) are vital but should be put outside the centre as much as possible. So we can see the successful Cascadia and Corridoria plus no doubt other new channels of activity as the new Route Peripherique’s along which jobs will be created!!
PS 1 On nov 19 2012 Richard Florida published a strong recommendation to strenghten the USA economy by boosting the most productive cities and metro areas, instead of launching national programs that treat all areas the same. See: http://t.co/Q2JJ5svI It is interesting to notice on the chart visible in that article that what I defined here as “corridors” also turn up ! (Map = courtesy of MPI’s Zara Matheson, copied from Florida’s article)
PS 2 (added nov 24, hat tip to @kwalitisme on Twitter) Erik Fisher made a number of ‘transit cartograms’ http://t.co/j98mSWy5 (click on the Guardian link) from the aggregate of thousands of paths of geolocated Tweets. In this way you can also see the transport “lifelines” through Europe appear:
Two things should be taken into account: (1) due to the relatively heavy use of Twitter in the UK and The Netherlands the picture us a bit skewed. (2) I guess that the aggregate is from people in public transport vehicles like busses and trains, since tweeting in cars is less done unless you are a passenger. Erik Fisher and I make the same point although the exact trajectories might differ: planning an building of transport and other infrastructures may benefit a lot from data from people’s movements and FLOW.
PS 3 An extensive MIT study confirmed the mentioned growth clusters and corridors ( MEGAREGIONS) in the USA : http://www.cascadianow.org/the-connected-states-of-cascadia/ (with my hat tip to Jeff Sterling again !) One of the illustrations of that article is the following. QED !! I am studying on a first draft of similar map for Europe, which I will show in my next blog.
Jaap van Till. connectivist ; version 1.6 Dec. 12
With thanks to Jan Smits and Jeff Sterling for their valuable contributions


Interessant! EvT
Summary: C O N N E C T T H E D O T S :-))
Interesting,but I still miss the ongoing movement. The dots and therefore, the links, are not statical, but differ in time (as you already mentioned given the Roman/Rhine structure). To know where to invest, given that any high investments takes decades to give a return, one should like to know where the actual corridor is in, let say 20 years from now. The question is wheter this can be determined from the past movements, or wheter there’s is no relation at all.
There have been several corridors in the past: The Hanze cities, the Roman roads (Paris – Rome – Constantinopel) and more recent, the corridor formed by the large airfields (Londen, Amsterdam, Paris, Frankfurt etc).
Besides: if both the maps given of the US situation are compared, the last map shows clearly that the area from Washington to Boston (east) has a higher productivity index than the West area (San Fransisco, San José, Seatle). And even when the Canedian cities are included, I would think the east side has more to offer. (two of the three largest Canedian cities are on the eastside),
So, the idea is very interesting, but I do miss the actual base or principles for defining those new corriidors. To me, based on this, it still looks like a random chosen line to prove something.
Hope you can use this critisism for a next version,
John
What i did is just showing a new pattern emerging, which may be unstable, sure. But nevertheless it can give us a useful tool to notice growth and feed it in combination with a number of factors. Best first step would be that a map of Europe is made showing the resective productivity indexes of the metropolitan area’s. We can then connect the dots and track the coming years if the trajectories (maybe other and different than my Corridoria line) are stabe or not. Sure my new idea shoud be firmly tested and most probably improved.
Pingback: What May Move America Movil into Europe | The Connectivist